First, it’s important to understand how U.S. equities have performed generally throughout history. We looked at the returns of the Standard & Poor’s 500 (S&P 500) during presidential years, dating back to 1928. Among the 24 U.S. presidential elections individual years (1928, 1932, 1936, etc.), the average yearly return of the S&P 500 was 11.57%, versus 10.01% over the entire historical period of 100+ years of the S&P 500 (Source: S&P Capital IQ).
The S&P 500 finished in negative territory in only 4 of the 24 U.S. presidential election years, or just 16% of the time. Two of these negative years were in 1932 and 1940, a period in which the U.S. was in the midst of the Great Depression and the Second World War. It would be another 14 presidential cycles before this happened again. In the 2000 presidential election, the S&P 500 once again finished in negative territory, on the back of the dot-com bubble. Eight years later, in 2008, history repeated as the U.S. dealt with the fallout of the Global Financial Crisis. However, the last three presidential election years have seen a return to relative normalcy, with the S&P 500 returning over 10%+ in 2012, 2016, and 2020 (Source: S&P Capital IQ).
Disproving the “elections year = market turmoil” connection, we delve into the investment history of election years, offering tactical analysis for “sidelined” investors willing to jump back into the game.
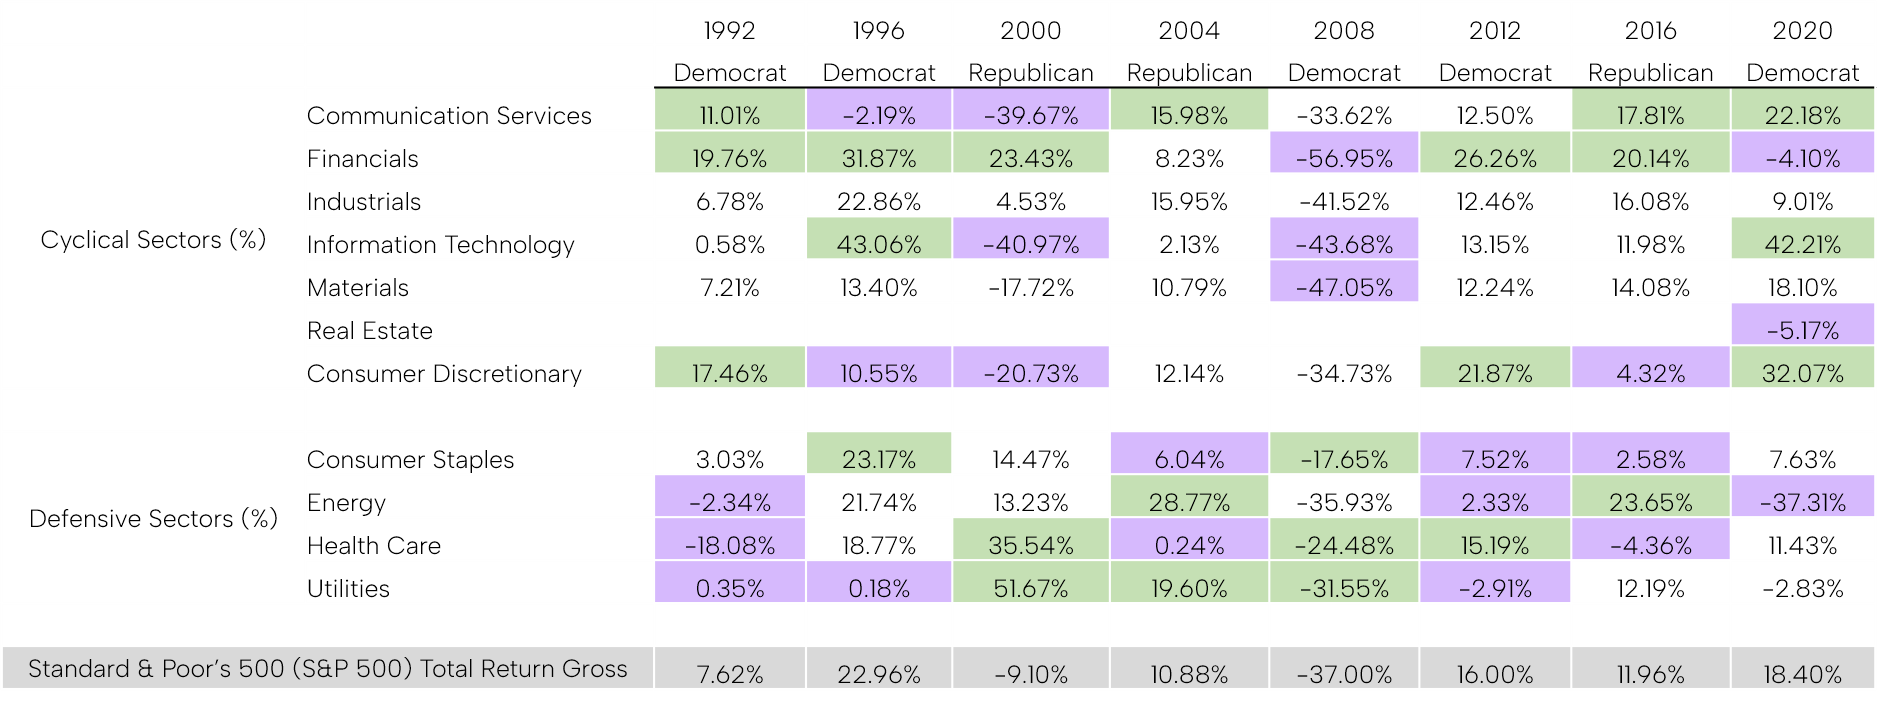
At the sector level, returns have generally been mixed during presidential election years. In the chart below, we have included sector returns for the S&P 500 over the last 8 presidential election years, separated them into cyclical and defensive sectors, and highlighted the top and bottom three performing sectors for each year (Source: S&P Capital IQ). We also included which political party was elected to office that year. At a high level, there appears to be no discernable trend in terms of which sectors tend to perform best in presidential election years.
SECTOR ANALYSIS BY ELECTION YEAR (1992 to Present)

SOURCE: S&P Capital IQ
In the lead-up to the 2000 election, defensive sectors performed quite well but this was likely the result of investors moving their money to areas they perceived to be safer following the turmoil of the dot-com bubble. The S&P 500 ended 2000 with a return of -9.10%, far lower than both the average return during presidential election years and below the historical average return across all years of S&P 500 history (Source: S&P Capital IQ).
2008 was marked by strong relative performance in the defensive sectors when compared with their cyclical counterparts. Coming out of the Great Financial Crisis, which was arguably the worst economic crisis since the Great Depression, investors favored less risky assets such as consumer staples and health care. Though these sectors were both down significantly for the year, they fared much better than the overall index, which returned -37.00%. 2008 was the second worst return ever for the S&P 500; only 1931 was worse when the S&P 500 returned -43.34% amidst the Great Depression (Source: S&P Capital IQ).
Cyclical sectors performed quite well relative to their defensive counterparts in the run-up to the 2012 election, when incumbent Democratic President Barak Obama was widely expected to win a second term. In an effort to stimulate the economy, the U.S. Federal Reserve held inflation in check and job growth, though still not back to pre-recession levels, was strong (Source: U.S. Bureau of Labor Statistics). Given that investors knew generally the outcome, stocks across sectors performed well.
As evidenced by the above, election years don’t offer any discernable trends in terms of the best sectors for investment. Rather, the macro-economic conditions preceding the election year were most determinative.
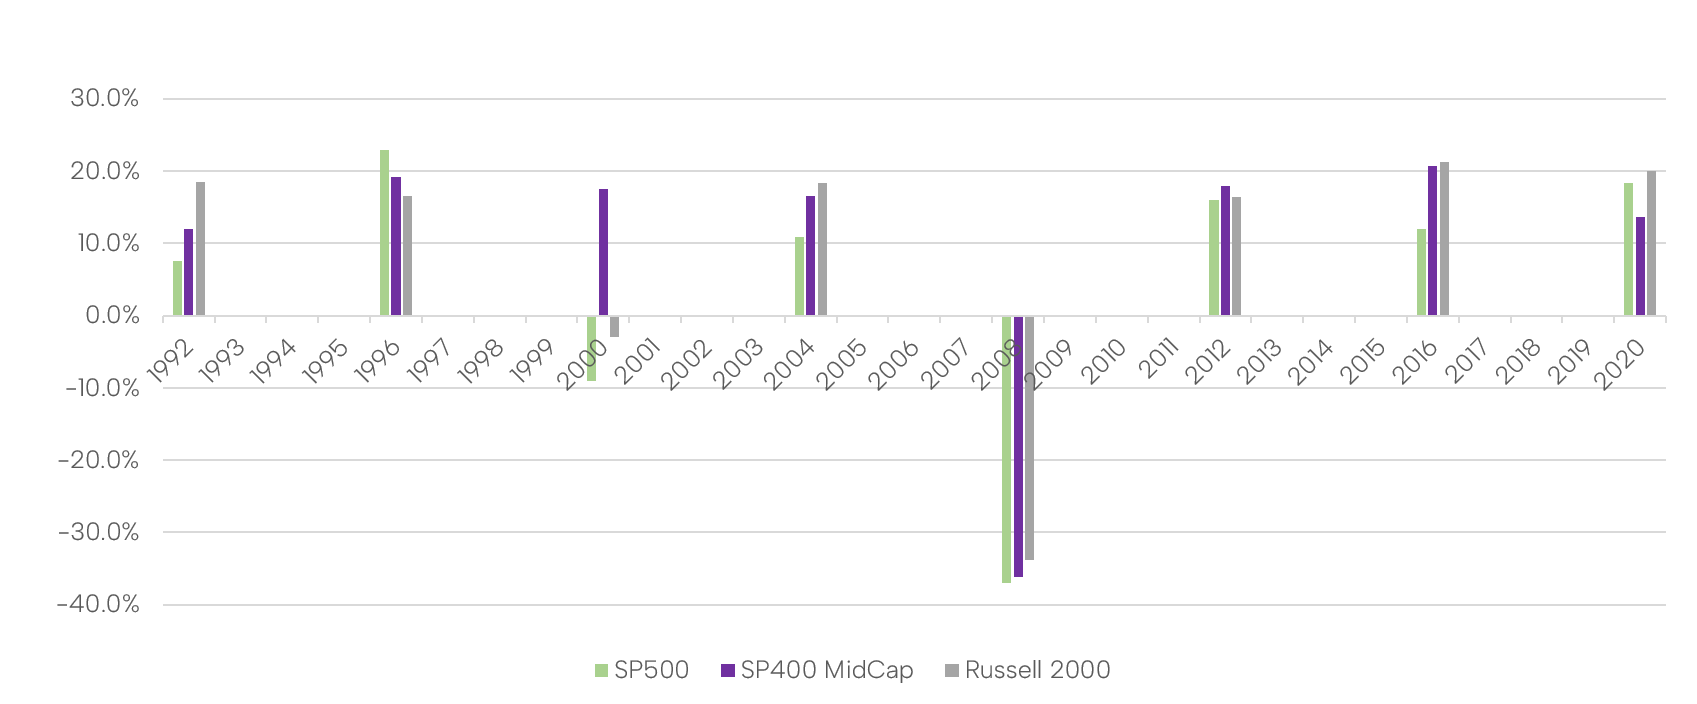
ANNUAL RETURNS IN U.S. PRESIDENTIAL ELECTION YEARS BY MARKET CAP (%) (1992 to Present)

SOURCE: MSCI & Factset
The market cap picture shows some interesting trends. In six of the eight election years above, mid and small-cap equities outperformed their large-cap equity counterparts. 1996 was the only year in which large-cap equities outperformed both mid- and small-cap equities. In fact, mid- and small-cap stocks have outperformed their large-cap counterparts by nearly 5% on average during the years represented above.
As we head toward the 2024 U.S. Presidential Election, the S&P 500 has returned 22.1% year-to-date through September 30, and appears to be on track for another year of positive returns (Source: S&P Capital IQ). Election of either party to the White House in November may not dramatically change the course of the markets; the only noticeable trends are 1) investors remain wary in election years and 2) small and mid-caps have generally outperformed in election years.
So what can impact U.S. markets in the lead up to the election? A preponderance of competing global events could change the course of the S&P 500 trajectory. Natural disasters such as Hurricane Helene and Milton, tensions in the Middle East, an ongoing war in Ukraine, and a worker strike at U.S. ports all pose threats to the stability of the global economy – the U.S. is not impervious to these issues. History has shown that macro trends are strong drivers of stock market volatility in any given year – regardless of whether or not that is an election year.
Polaris Capital Management LLC is an investment advisor registered with the U.S. Securities and Exchange Commission (SEC). Polaris' website provides general information regarding our business along with access to additional investment related information. Material presented is meant for informational purposes only. To the extent that you utilize any financial calculators or links in our website, you acknowledge and understand that the information provided to you should not be construed as personal investment advice from Polaris or any of its investment professionals. For additional information regarding our services, or to receive a hard copy of our firm's disclosure documents (Form ADV Part I and Form ADV Part II), contact client service. You may also obtain these disclosure documents online from the SEC Investment Adviser Public Disclosure (Firm CRD# 106278). ©2013-2025 Polaris Capital Management, LLC. All rights reserved.
This website uses necessary cookies to make our site work. A handful of non-essential cookies seek to enhance the browsing experience, analyze website traffic and improve site usage and functionality via analytics. By clicking “Accept“, you consent to accept these non-essential cookies; however, you can opt-out by clicking "Deny". See our cookie policy here.
IMPORTANT INFO: RETIREMENT CALCULATOR
The retirement calculator is a model or tool intended for informational and educational purposes only, and does not constitute professional, financial or investment advice. This model may be helpful in formulating your future plans, but does not constitute a complete financial plan. We strongly recommend that you seek the advice of a financial services professional who has a fiduciary relationship with you before making any type of investment or significant financial decision. We, at Polaris Capital, do not serve in this role for you. We also encourage you to review your investment strategy periodically as your financial circumstances change.
This model is provided as a rough approximation of future financial performance that you may encounter in reaching your retirement goals. The results presented by this model are hypothetical and may not reflect the actual growth of your own investments. Polaris strives to keep its information and tools accurate and up-to-date.
The information presented is based on objective analysis, but may not be the same that you find at a particular financial institution, service provider or specific product’s site. Polaris Capital and its employees are not responsible for the consequences of any decisions or actions taken in reliance upon or as a result of the information provided by this tool. Polaris is not responsible for any human or mechanical errors or omissions. All content, calculations, estimates, and forecasts are presented without express or implied warranties, including, but not limited to, any implied warranties of merchantability and fitness for a particular purpose or otherwise.
Please confirm your agreement/understanding of this disclaimer.
DISCLAIMER: You are about to leave the Polaris Capital Management, LLC website and will be taken to the PCM Global Funds ICAV website. By accepting, you are consenting to being directed to the PCM Global Funds ICAV website for non-U.S. investors only.